Templates informations in Web Debug Toolbar
The Web Debug Toolbar provides informations about Templates.
The available informations are the number of rendered templates, and the list of files, ordered with rendering duration.
Web Debug Toolbar
When the Web Debug Toolbar is popped, you can read the number of templates used, dispatched between :
- Twig templates
- legacy templates
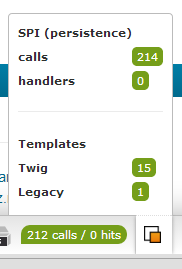
Count of rendered templates in the Web Debug Toolbar
Then you can get the detail for both category of templates.
Profiler for Twig templates
The profiler, for eZ Publish twig templates, displays a list of loaded templates. The columns of the table are :
- order
- template name
- template time : the returned time includes the time spent in child templates

Profiler for legacy templates
The profiler, for legacy templates, displays a list of loaded templates. The columns are :
- order
- the requested template name
- the override template name : used for rendering, according to the configuration
- the template path

Sarah Haïm-Lubczanski (17/03/2014 8:29 am)
Sarah Haïm-Lubczanski (17/03/2014 11:18 am)
Comments
There are no comments.